Help us build this. Leave comments, suggest improvements, and help create better design documentation for agents.
ChartHop
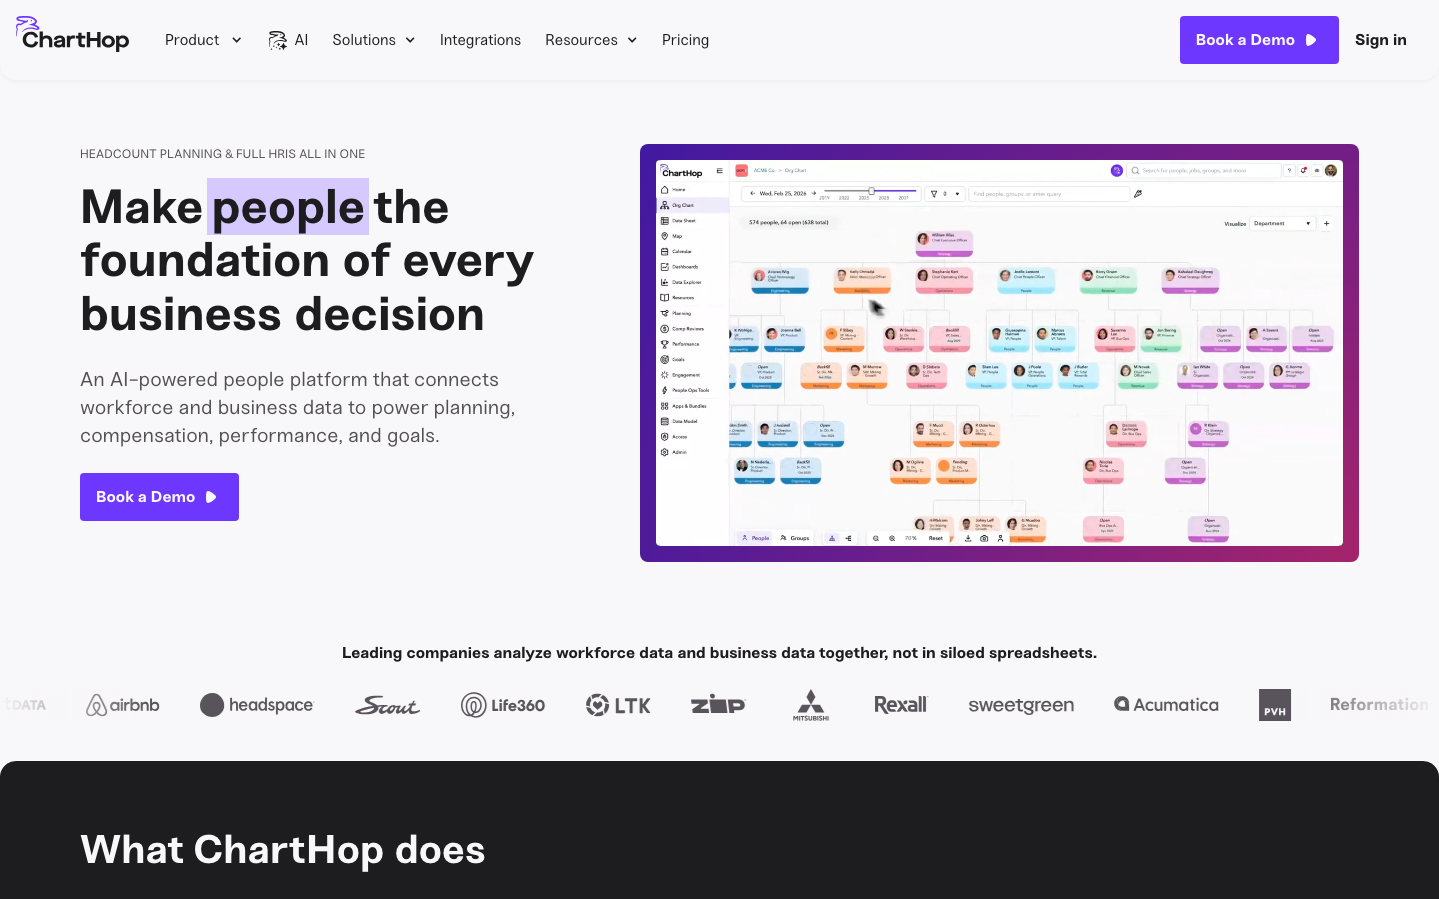
HR TechChartHop projects sophisticated enterprise intelligence through its custom 'Sneak' typeface and rich violet-to-fuschia gradient palette. The design balances data visualization complexity with approachable warmth, using organic organizational charts as the hero element rather than typical SaaS dashboards.
Design Identity
Signature Color
ChartHop Violet
#6e37ff
executive-level intelligence and data-driven decision making
Visual Identity
Colorful, interconnected organizational chart visualizations with people-centric nodes arranged in organic, flowing hierarchies rather than rigid corporate structures
Component Style
Medium rounded corners (8-12px) with subtle elevation through soft shadows. Buttons have substantial padding with confident weight, while the interface maintains gentle gradients and colorful categorical coding throughout the org chart elements.
Spacing Philosophy
Asymmetrical layout with concentrated data visualization on the right balanced by generous whitespace on the left. The org chart uses organic spacing that follows natural hierarchy flows rather than rigid grid systems.
Design Principles
- Custom 'Sneak' typography exclusively across all weights and sizes
- Violet (#6e37ff) as primary action color with hover state (#4119a1)
- Org chart nodes use color-coding across violet, orange, pink, green, and blue families
- 48px headlines with 700 weight for maximum impact
- Muted backgrounds (#f8f7f9, #f0eef1) to let data visualizations dominate
Target Audience
Chief People Officers and senior HR leaders at growth-stage companies who need to visualize workforce analytics and organizational design
Mood
Design descriptions are AI-generated based on visual analysis and may not fully reflect the brand's official design guidelines.
Design System
Typography Scale
| Element | Font | Size | Weight | Line Height |
|---|---|---|---|---|
| body | 16px | 400 | 24px | |
| h1 | 14px | 400 | 19.6px | |
| h2 | 48px | 700 | 53.76px | |
| h3 | 16px | 700 | 19.2px | |
| h5 | 24px | 700 | 28.8px | |
| h6 | 20px | 700 | 28px | |
| p | 15px | 400 | 24px | |
| a | 16px | 400 | 24px | |
| nav | 15px | 400 | 24px | |
| header | 16px | 400 | 24px |
Color Palette
#f8f7f9#1d1c1f#f0eef1#524e55#d5c9ff#6e37ff#000000#38353b#6e0e55#19004d#e5e2e6#22034a